One of the most-discussed civil rights issues in the United States today is the ‘discipline gap’ — disparities between which kids get harsh punishments like suspensions and expulsions and which don’t. The most commonly-cited disparity is racial: black students are suspended three times more often than white students, according to a 2014 civil rights report from the U.S. Department of Education.
Less discussed is the disparity facing disabled students. That same report showed that disabled students are twice as likely to get an out-of-school suspension as non-disabled students. But how does this disparity break down state by state?
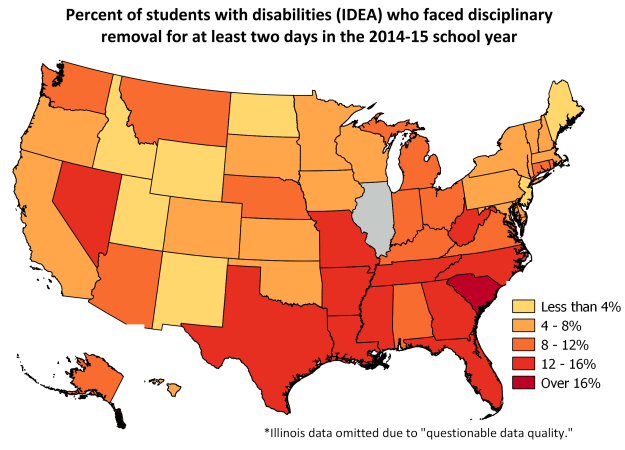
To find out more, I used data from the U.S. Department of Education to calculate the percentage of all students with disabilities who got kicked out of class for at least two days during the 2014-15 school year. That includes in-school suspensions, out-of-school suspensions, expulsions, or any other instance where the child was removed from their normal class for a serious offense.
Note that this data doesn’t include all students with disabilities, just those that get covered under a federal law called IDEA (Individuals with Disabilities Education Act). Autism, deafness, emotional disturbances, and learning disabilities are some of the various conditions covered under the act — basically, the students in special education.
I made this map so that I could begin noticing trends and asking questions. It’s just a beginning into the inquiry, not the full story. Here are the first observations that spring to my mind:
- What’s wrong with Illinois? The Department of Education’s data listed the number of students with out-of-school suspensions or expulsions, but not in-school suspensions or other disciplinary removals. A note in the spreadsheet stated that the data was “flagged due to questionable data quality.”
- Of all the states, why does South Carolina have the highest percentage of disabled students facing disciplinary removal? (D.C. actually has a higher percentage, but it’s apples and orange to compare a city and a state.)
- Would the map look different if we controlled for disability and race? Do all students with disabilities have higher removal rates regardless of their race?
- Do states that spend more on special education discipline students at lower rates? If kids in special education aren’t getting the resources they need, that could lead to more behavior problems. But of course, just because you spend more money doesn’t mean you spend it wisely. I haven’t found data yet on special education spending specifically, but looking at this map of education spending in general, I don’t see patterns that readily explain the discipline trend.
- A handful of states like New Jersey and Idaho are disciplining kids at rates four times lower than the highest states. Why? Was this the result of some specific policy that other states could replicate? Spending more money? There could be some demographic explanation, since most of the less-disciplinary states are rural, but then New Jersey breaks the pattern because it’s got several diverse, urban school districts like Camden and Newark.
- The South stands out as dark red. I can think of three possible explanations: culture, money, or demographics. The South might have a more disciplinary culture to begin with (take a look at this map of corporal punishment across the United States, where the South stands out). States in the South have larger black populations, and black students are already three times more likely to be suspended, so that would probably increase the percentage of disabled students who are suspended too. (West Virginia is then a counter-example: it has a small black population but still ranks in the top 10 for states that punish students with disabilities.) Finally, maybe schools in the South spend less on special education.
- How has this data changed over time?
Here’s a chart with all the states ranked from most to least disciplinary, plus some U.S. territories and D.C. Interestingly, Puerto Rico is at the very bottom — they have the lowest discipline rates. I don’t know if their disciplinary policies are different from the mainland. Considering that the island has faced financial troubles for years, I doubt that they spend more than average on special education.
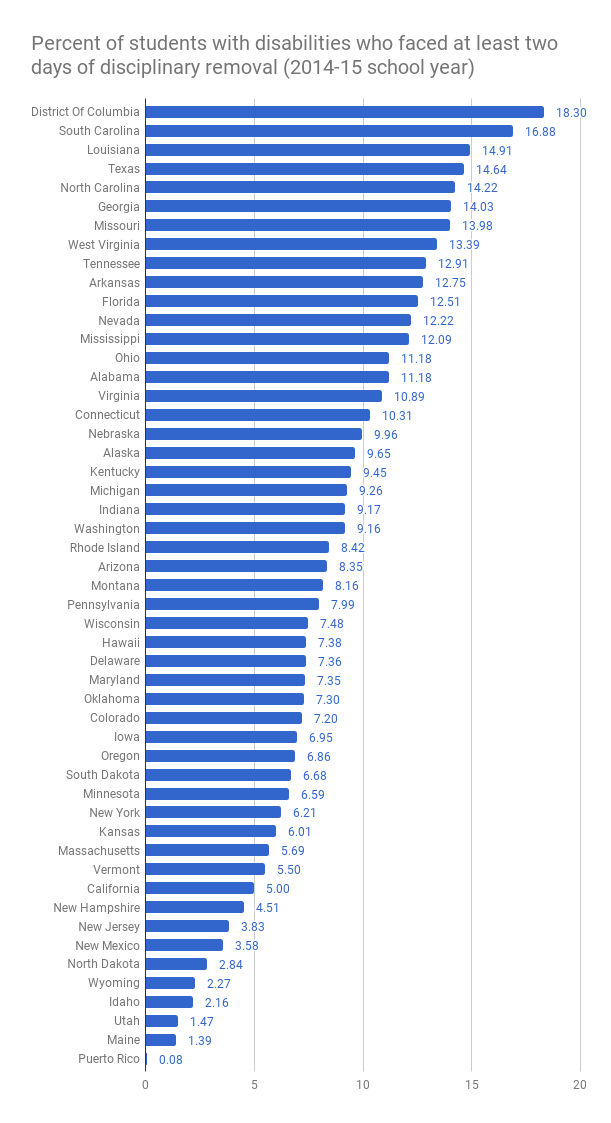
For reference, the average for all of the United States (including territories) is 8.56 percent.
Some nitty-gritty details:
Methodology: Using data from the Department of Education’s website, I found the total number of students covered under IDEA in the fall of 2014 and the total number of students who faced disciplinary removal in the 2014-15 school year. (Some students covered under IDEA aren’t in public school — they might be taught at home or in an institution — but I included all of them since they get special education services from the state.)
I then calculated the percentage of students who were removed in Excel and mapped them in QGIS. You can see the original data tables going all the way back to 2005 here.
The exact definition of a disciplinary removal, according to the Department of Education: “Any instance in which a child with a disability is removed from his/her educational placement for disciplinary purposes, including in–school suspension, out–of–school suspension, expulsion, removal by school personnel to an interim alternative educational setting for drug or weapon offenses or serious bodily injury, and removal by hearing officer for likely injury to the child or others.”
